Creating Forms and Reports in Microsoft Access
Although we won’t get to the topic of database applications until a bit later in the course, Microsoft Access makes it easy to begin exploring this subject early, using its forms and reports features. The simplest forms allow us to make the entry and viewing of data much easier, but they also provide the capability to construct an entire sophisticated graphical user interface. Reports in Access provide a great deal of flexibility in terms of how data can be displayed for printing. Forms and reports can work seamlessly together, often connected by macros, small pieces of special-purpose code that is invoked by the user.
This assignment was originally written by Dr. Kevin Treu and used in CSC-341: Database Management Systems at Furman University.
Working with forms
Forms allow us to create a graphical interface for a particular database. This capability is especially valuable if the database is to be used by individuals who know nothing about databases, but who need the information stored in it. It is possible, for instance, to set up the system so that it automatically opens the database and displays a master form that is linked to all the other forms used by the database. This environment will be precisely the kind that many users will need. Forms also can make data entry and retrieval easier for novices and experts alike.
The objective for this part of the assignment is for you to create forms as part of your Access database. In particular, you are to do the following:
- Create the forms shown later in this document. The forms are to be saved as part of the database.
- Make the buttons on each form perform the indicated action. These buttons require you to learn to work with macros.
Creating forms
- Select the Create ribbon and choose Form Wizard. Notice that you must base the form on a table or a query. Our first task will be to create a form for the course table, so choose Course from the pulldown menu.
- This Form Wizard window allows you to choose which fields of the selected table or query to include in your form. (You may also use this window to add additional fields from other tables and queries, though we won’t be doing that with this example.) Add all of the fields of the Course table by clicking on the » button. Then click Next to move on to the layout window.
- Choose the option “Columnar”. As you can see, there are other layout options provided by the wizard. You should realize that after a form has been created with a wizard, you can move fields, add control buttons, change colors, change font sizes, and so forth—the wizard just does most of the initial work for us. So even though we choose “Columnar” now, we can always change it later. In most cases, however, the form produced by the wizard is so good that you do not have to do a great deal of additional work on it.
- Next we give a name / title to the form and click the Finish button. The title is the name that will appear in the title bar of the form window and will be the name listed for the form in the main database window. A commonly used convention for naming forms is to place “F” before the name of the table or query that the form is the interface for. Using this convention, set FCourse as the name of this form.
- Choose the option “Open the form to view or enter information” and then click Finish. The form for the Course table is now finished – the first draft is, anyhow. To see how this is an interface for the underlying table, click on the navigational arrow buttons at the bottom of the form. The data from the Course table will be displayed.
Modifying / Editing Forms
We will now illustrate modifying the form by (1) giving the form a title, (2) editing the form to make it look better, and (3) adding a button that performs a function.
- First, return to the Home ribbon. Then switch to Design View by clicking on the View button in the upper left-hand corner of the Access display. While you are in Form View (which you’re in right now), the button shows design tools including a ruler and pencil. When you switch to Design View, the main ribbon changes to the Form Design Tools ribbon. Move the cursor over each of the buttons in the Controls section to determine their names.
- Next, take a moment to study the different areas of the form that the wizard created for you. The form has been divided into areas similar to those of a word processing document. There is a Form Header into which any information can be entered that is to appear above any record being displayed; a Detail region that displays field labels and the data for fields, and there is a Form Footer region for information to be displayed beneath the currently displayed record. (You may have to expand the window to see the footer.)
- To begin editing the design of the form, we’ll first add a title, or rather modify the title Access has given us. First, make space for the title by clicking on the top of the Detail bar and dragging downward a bit. Then click where it says “FCourse”. The title object will be selected. (You could also choose the Title tool from the ribbon to do this.) Click again in the rectangle and change the title to “Courses”. Then select the entire label by clicking the Select button in the ribbon (or simply by clicking outside the title and on it again). While the label is selected, you can change the size of the text, the font, color, background color, etc. Experiment with this a bit, and create a decent-looking design different from the default. Note that you can move the label by moving the cursor over the border while it is selected. You can also resize the title by clicking and dragging the square anchors that appear when it is selected. Return to Form View briefly to see how it looks. Then click back to Design View.
- The Detail area of the form contains labels and text boxes provided by the wizard. You can now modify these in terms of size, font, orientation, etc. to suit your tastes or specifications. Begin by changing all the labels so they use capitalization and spaces instead of the original column names. (For instance, “Course Number” instead of “coursenum”.)
- To see how the text boxes are actually linked to specific table fields, select one of them, then right-click on it and choose the Properties option. The value listed in the “Control Source” box of the Property Sheet specifies which data will be displayed in the text box. This value you don’t want to mess with.
- Resize all of the label boxes so they are no larger than the text that they contain. Then right-align them all (both the label boxes and the text they contain). You can do this by shift-clicking to select all four labels, then right-click on one of them and choose “Align” to align the boxes. Align the text in the “Text Formatting” portion of the Home ribbon. Make the labels a bit larger, and put some extra space between them. Slide the Form Footer bar down a bit if necessary. Make sure everything lines up nicely. Note that when you move a label box, the associated text box moves along with it. The converse is not true.
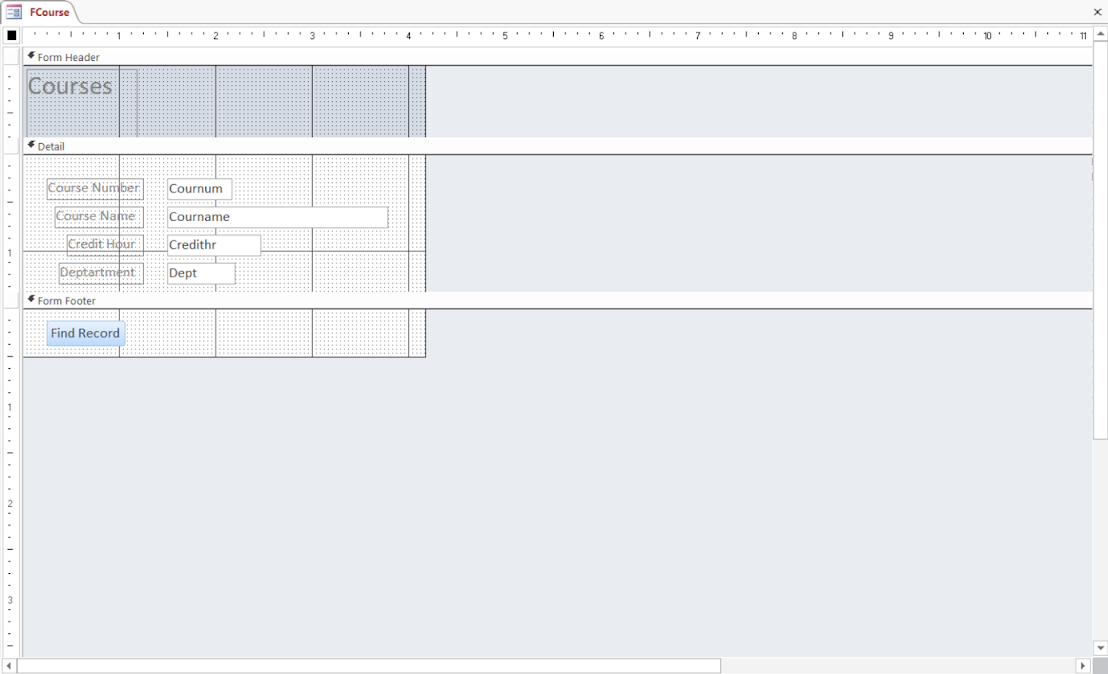
- Finally, we’ll add a button to the form. To insert a button, we click the Button button in the ribbon. Move the cursor crosshair to a location in the Form Footer, press the mouse button, and drag to draw the button. When the mouse button is released, the Command Button Wizard is displayed. Highlight the category of action to be performed in the left box and highlight the specific action to be performed (when the button is clicked) in the right box. Choose “Record Navigation” and “Find Record” for this example. Then continue through the wizard, giving a name (or picture) for display, and an internal name that will be used later as sort of a variable name in a database application.
-
Something similar to the following picture is the result of the work described above. Switch to Form View and try the “Find Record” button. A dialog box will be displayed which will allow a user to search conveniently through the table for a specific record.
- What the wizard has done here is automatically create a macro written in Visual Basic for Applications (VBA). This macro is executed when the button is clicked. You can get a look at the script by right-clicking on the button in Design View, selecting Properties, clicking the “Event” tab in the Property Sheet and then clicking on the three dots (“…”) that appear when you click in the “On Click” window.
More practice with creating forms
Create the following forms as part of your grades database. Your forms do not have to look exactly like the forms shown here, but they should contain the same information and the same buttons. Colors, location and size of fields and their labels are choices that you can make. You should, however, attempt to produce attractive as well as useful forms that differ from the defaults.
- FStudentInfo
- Note the inclusion of the calculated field for GPA. Can you figure out how to
include it and format it to two decimal points?
Hint: GPA is calculated by dividing hours attempted into quality points. Also note that the wizard gives you a checkbox field instead of a text field for Financial Aid information. Can you figure out how to change this?
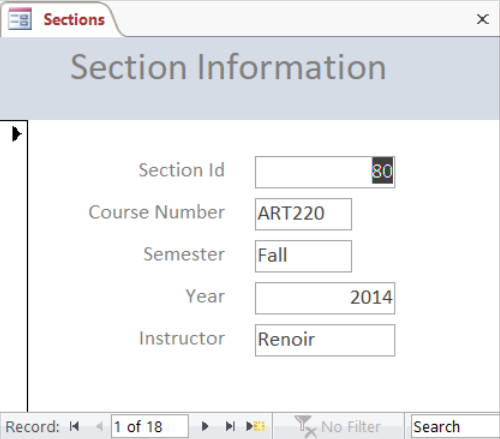
- FSections
-
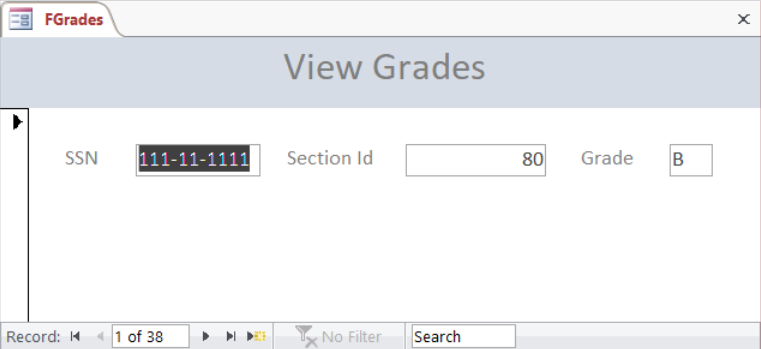
- FGrades
-
- FCourse
- Complete the form you started previously.
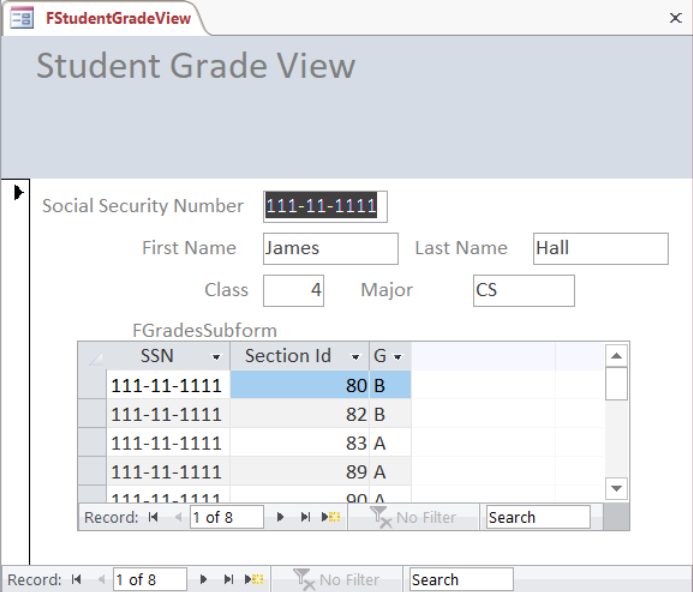
- FStudentGradeView
- Begin just like you did for FStudentInfo. Use the Subform/Subreport tool.
When you build the subform in the wizard, choose “Use existing Tables and
Queries” instead of “Use an existing Form”, even if you’ve already created
FGrades (which contains exactly the information you need.) This is because
FGrades is set up to use Form View. To use Datasheet View (as shown above),
you’d have to change the default format. Better to simply have a second form
– named FGradesSubform – that has the datasheet view as the default. Do you
see the role that a foreign key is playing?


Creating Reports
The objective for this part of the assignment is for you to demonstrate your proficiency in creating reports in Microsoft Access. In particular, you are to do the following:
- Create the reports shown later in this document. The reports are to be saved as part of the database.
Both forms and reports are based on pre-existing tables or queries. Forms (as we have seen) are intended to serve as interactive interfaces between the user and the database. Because of their interactive nature, forms contain buttons and other features to help the users improve their productivity. Reports are intended to be printed or otherwise displayed. In general, reports are simpler to work with than forms.
When you create a report you are basically performing a word processing activity to display the result of a query. Your knowledge of word processing transfers almost completely to the generation of reports.
Creating a simple report
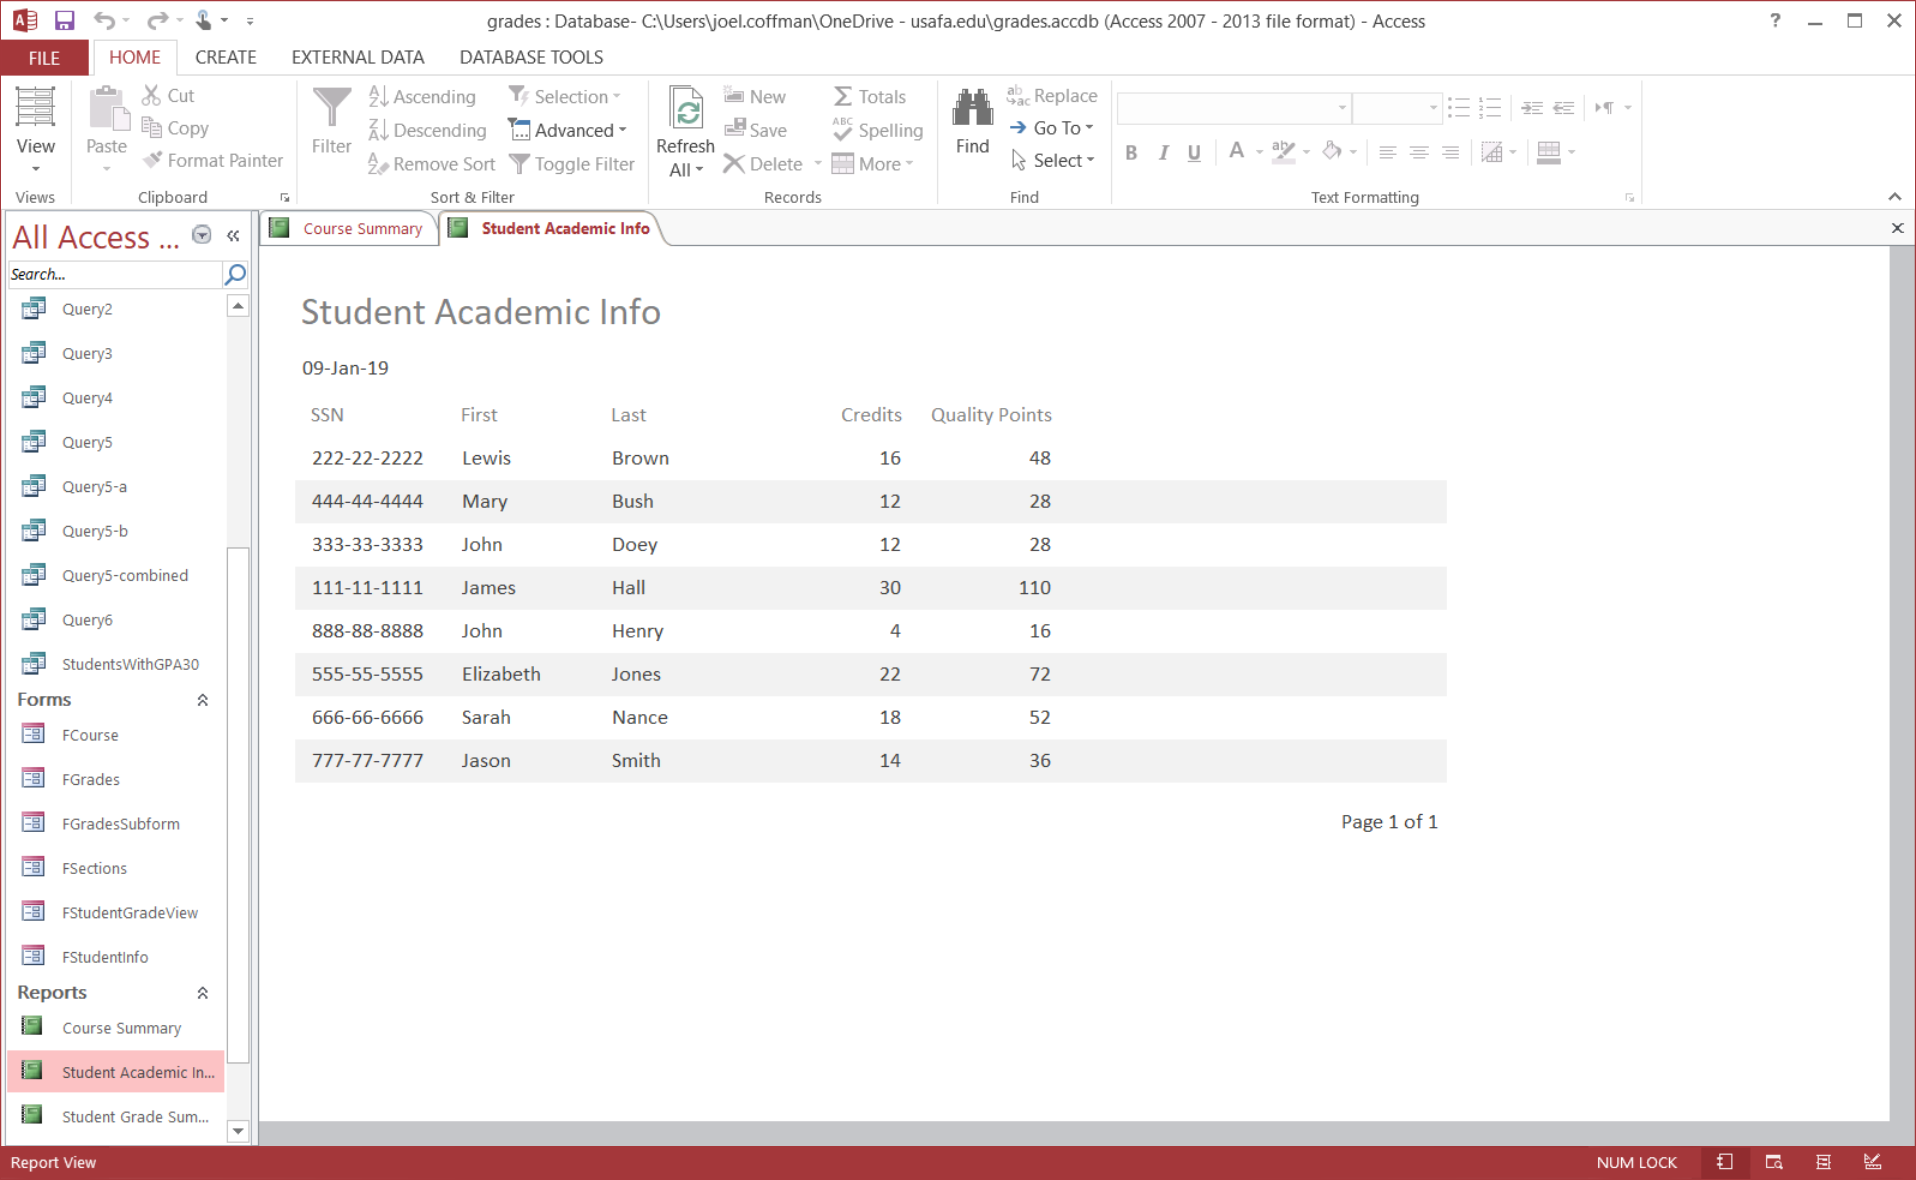
To illustrate the process of creating a report, some of the details will be given for creating the following student academic report.
- In the Create ribbon, click the Report Wizard button. Choose the Student table in the pulldown menu.
- Next we choose which fields will be included in the report. In turn, select the field names SSN, First, Last, HrsEarned, and QualityPoints, clicking the > button to move them into the “Selected Fields” area. Click Next.
- The next window presented by the wizard allows us to create subgroups of the report. For instance, if this were a report of the students enrolled in several classes, we would want to create subgroups according to the course title. (One of the reports that you’ll create next calls for exactly this approach.) This example doesn’t require any subgroups, however, so click Next.
- Choose “Last” as the field to use for sorting, with “First” as the secondary sorting key, and click Next again.
- Choose “Tabular” for the layout and “Portrait” for the orientation. Click Next.
- Give the report the name Student Academic Info and click Finish to preview what the wizard did. The name you choose will be inserted as the initial title for the report. So it is okay to use capitalization and spaces here.
- As we did in the forms activity, we turn our attention now to formatting the
report. Switch to Design View by exiting out of print preview. (You can
toggle back and forth between different kinds of views the same way you did
for forms.) Notice the structure of the Report design window. In addition to
a ruler there are areas for a report header, a page header, details (i.e.,
the data of the report), a page footer, and a report footer.
- Regardless of the length of the report, even if it contains many pages, information in the report header and the report footer will be printed just once, at the beginning and the end of the report, respectively.
- Information in the page header and the page footer will be printed on every page. Notice that the page header contains column headings for the fields that were moved into the report. On the report, you can move these by clicking on the surrounding box of a header and dragging to a new location.
- The names of the fields in the detail area will be replaced by data when the report is printed. These field names can also be moved on the report design window by using the technique described for forms. The size of a field can also be changed by placing the pointer over a line or corner, clicking and dragging. You have control over every aspect of the report.
- Note the inclusion of the special page number and date fields provided by the wizard. These can be removed, moved, or otherwise modified just like the other fields. Another special kind of report field is a computed field, which allows you to compute sums, averages, etc. of table data much like you do with a spreadsheet. In general, everything here works just like it does in the form Design View.
- Edit the form layout to roughly correspond to prior image. Use any style (colors, fonts, etc.) that you like, just make sure the data is arranged in roughly the same way.
- Re-format the current date field as shown in the screen capture, and place it in the header, rather than the footer.
- Switch to Report View to view the desired report.
More practice with creating reports
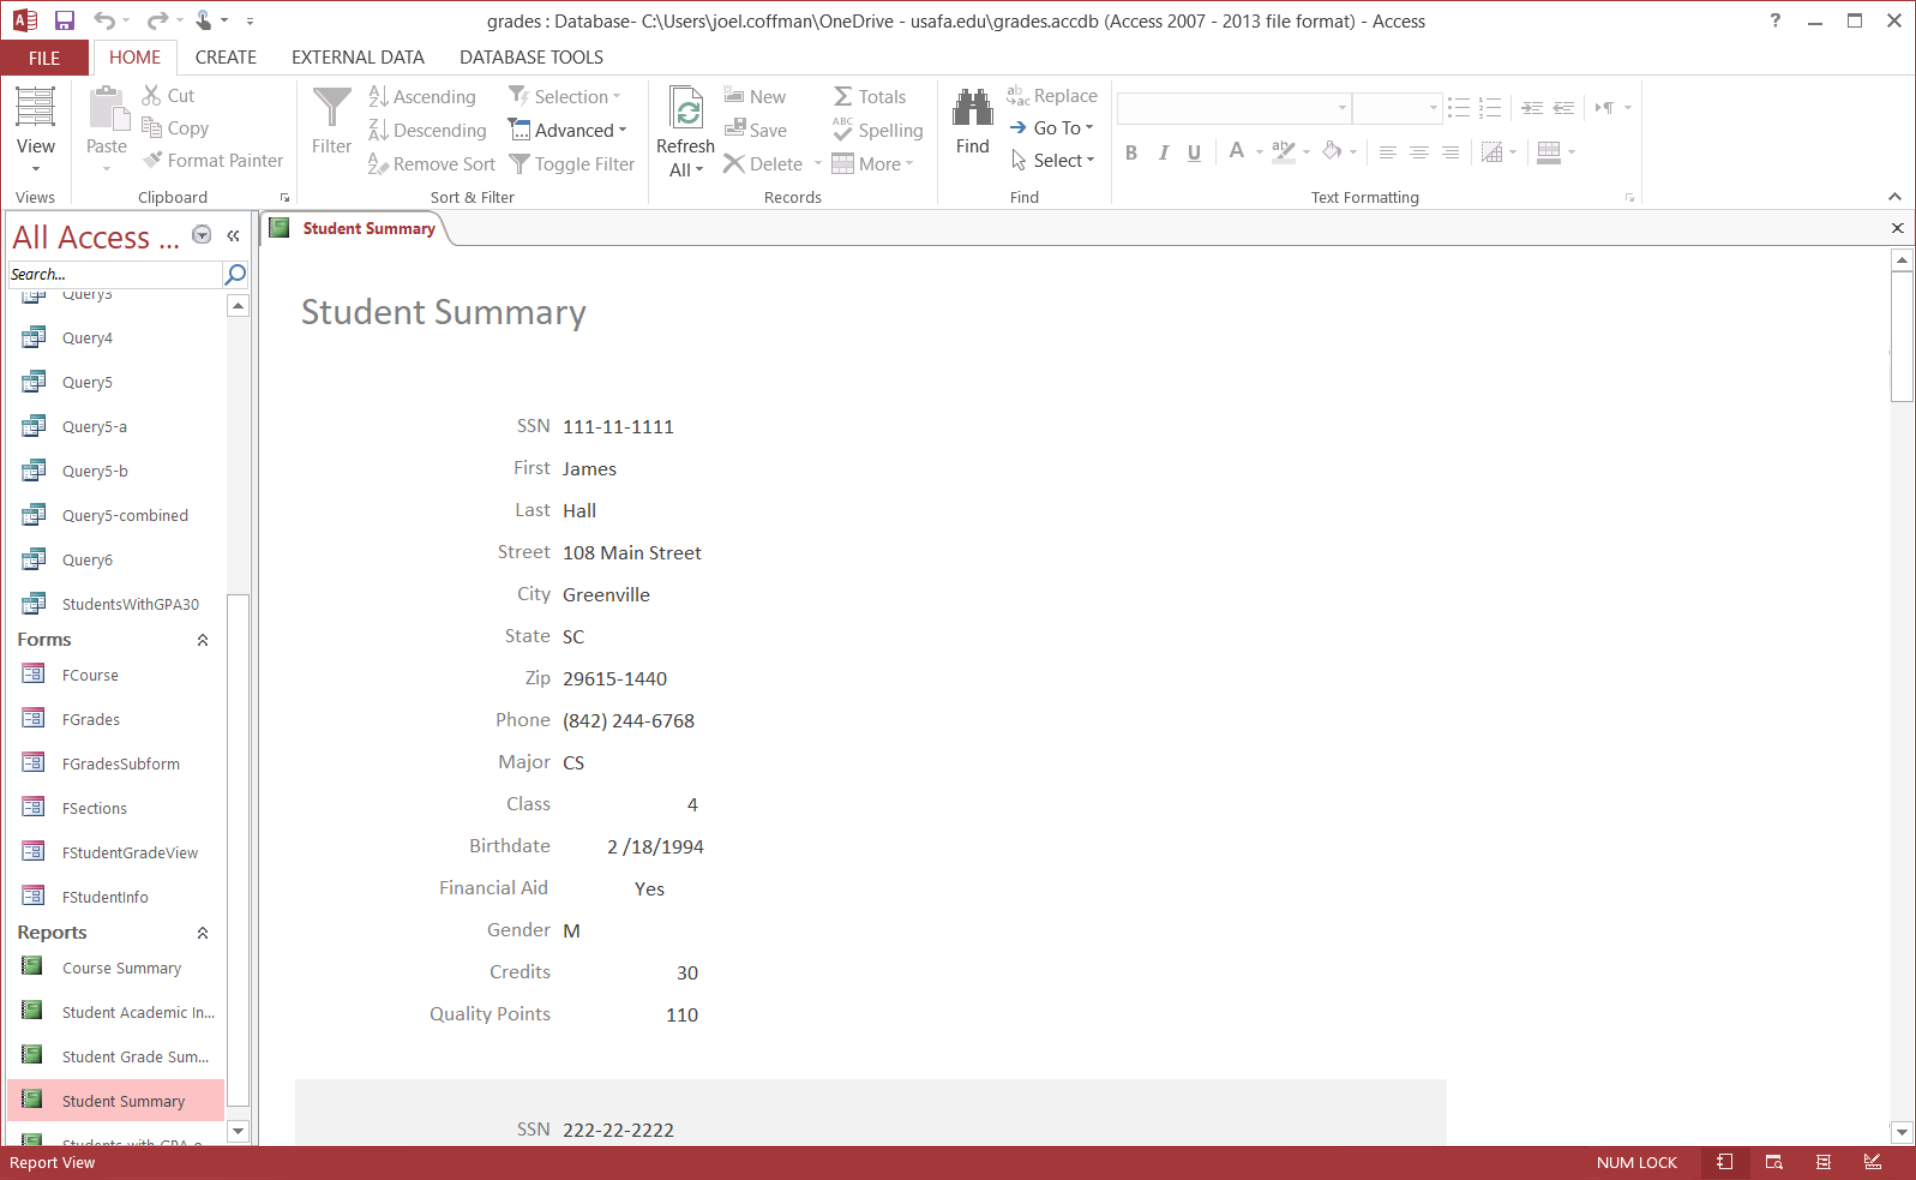
Each of the following is a portion of a report that you are to produce. Just enough of each report is given to illustrate what you should be creating. For example, the portion of the Student Summary given below shows information for a student. However, the entire report includes information about all the students in the database. Save the reports as part of your database under the name given for the report (i.e., “Student Summary”). Note that the data in your reports might not match the pictures exactly.
- Student Summary
- The Student Summary report is based on the student table. It can be
produced very quickly using the wizard for a single column report.
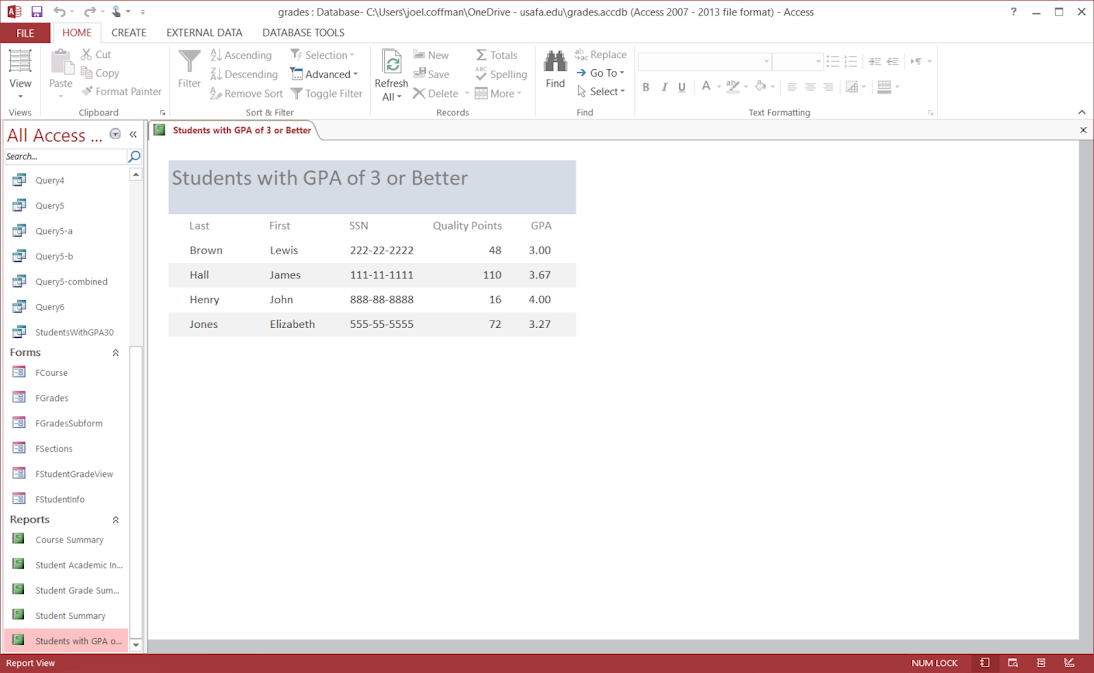
- Students with GPA of 3.00 or Better
- The data for the report Students with GPA of 3.00 or Better comes from a
query that you must create and save. The GPA is a computed field. Use quality
points divided by hours attempted as a field of your query. Put the following
in the “Field” box of the query-by-example (QBE) grid to do this:
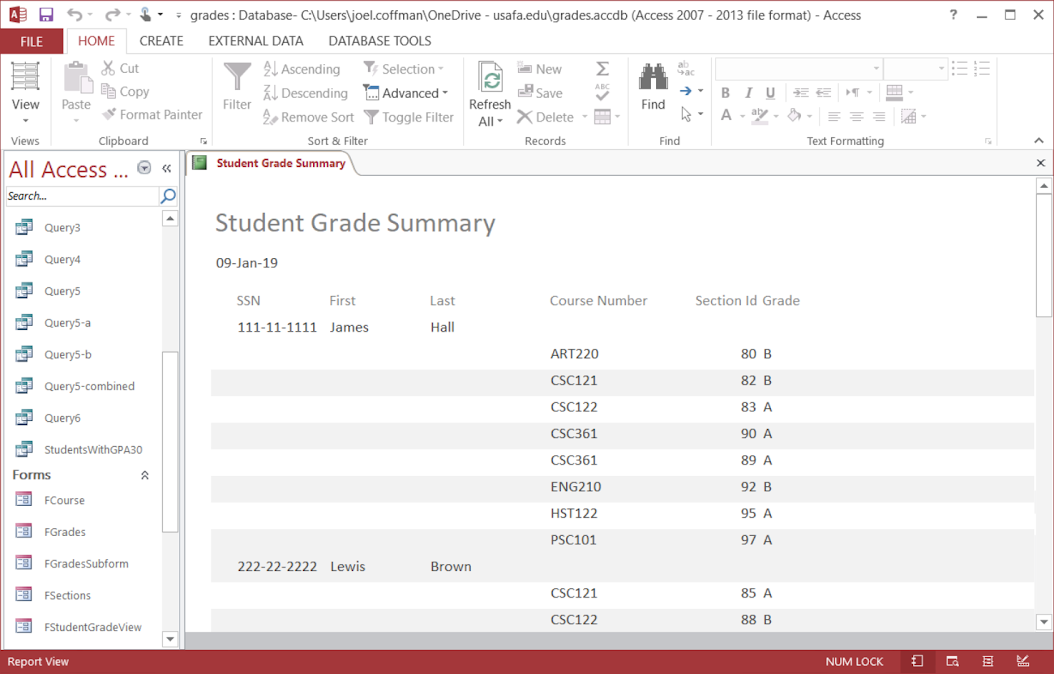
GPA:
[QualityPoints]/[HrsAttempted]
. Format the GPAs to two decimal places. - Student Grade Summary
- For the Student Grade Summary, the information is distributed over the
Student, Grade, and Sections tables. There are two different ways to generate
the desired report. The first is to use a new query, much like you did for
the previous report. The second is to simply use the report wizard to pull in
the fields that you need. Start with the Student table, then select “Cournum”
from the Course table, “Secid” from the Section table and “Grade” from the
Grades table. It might be a good idea to try both methods. In either case,
you should use the sort property to cause the information to be printed in
the indicated order. Also note the use of grouping levels (though just the
defaults in this case) and the inclusion of today’s date.
- Course Summary
- The Course Summary report involves the Course, Sections, Grades, and
Student tables. Again, you may use a query as the basis for the report, or
pull everything together in the wizard. Notice the sorting that is to be
done, and the use of multiple grouping levels. The trick is making the right
selection in “How do you want to view your data?”